Terminal Digital Twin
Summary
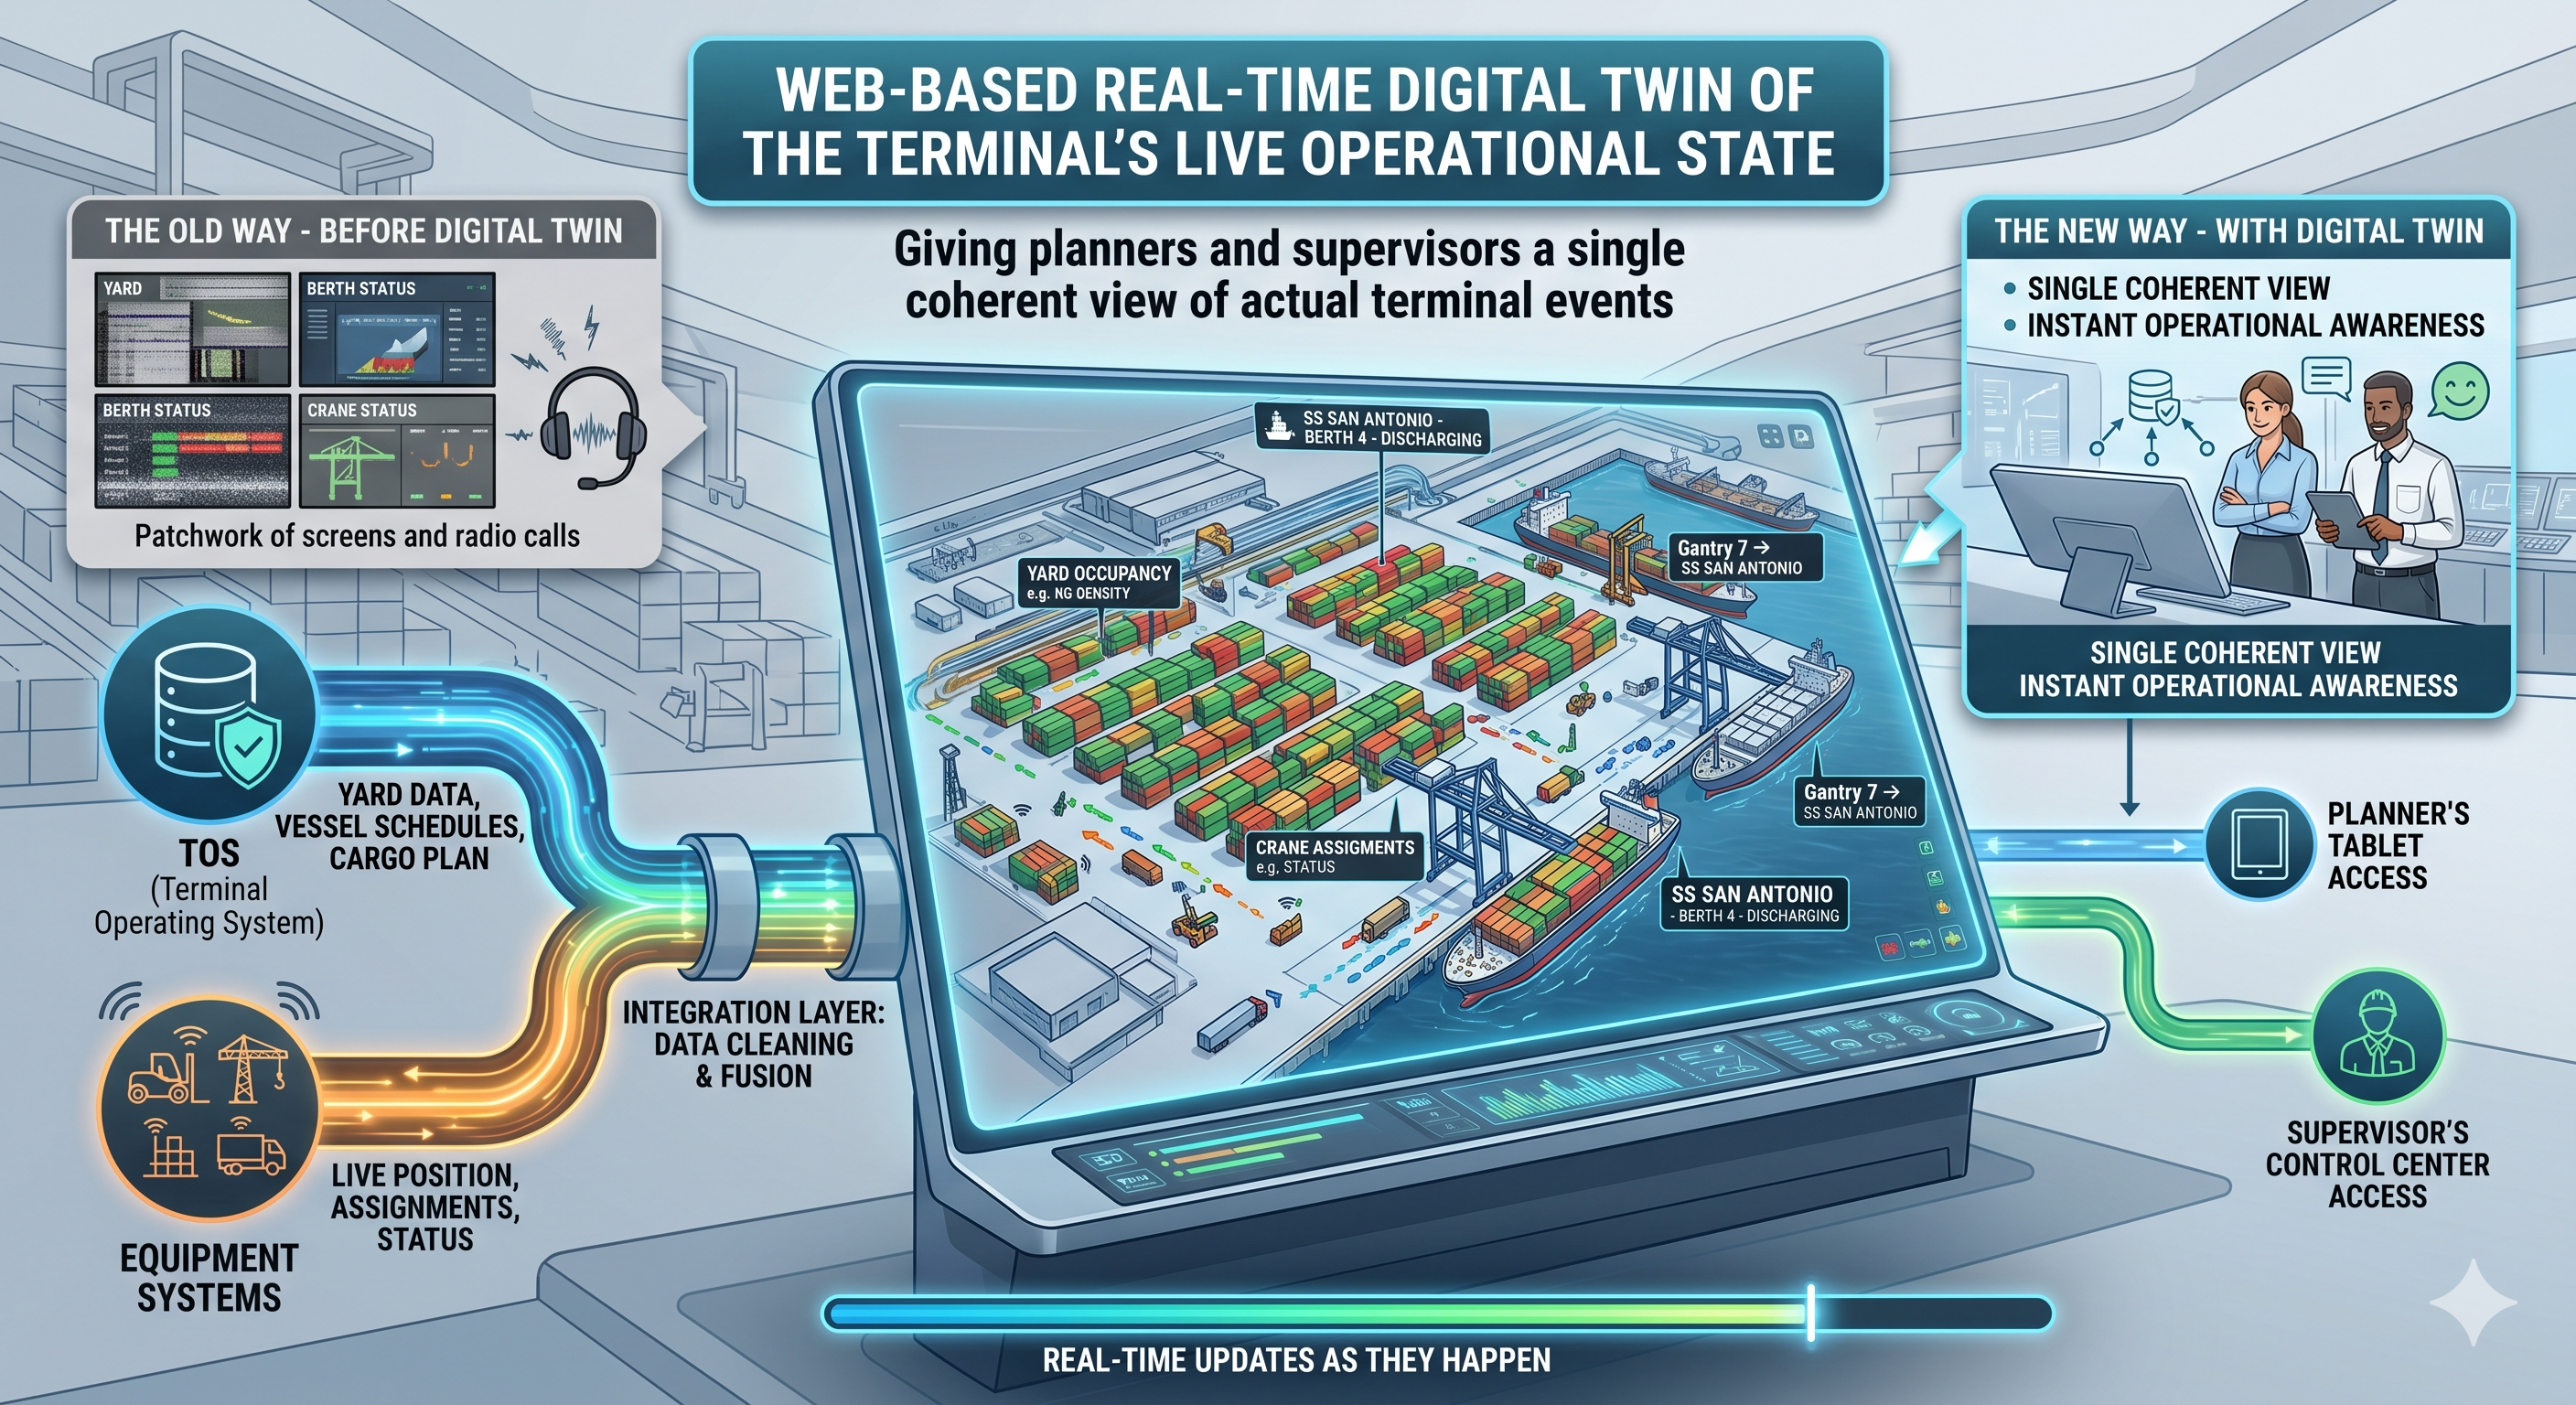
A web-based digital twin of the terminal’s live operational state — ingesting data from the TOS and equipment systems to render yard occupancy, vessel positions, crane assignments, and equipment movements as they happen. Designed to give planners and shift supervisors a single coherent view of what is actually happening on the terminal, replacing the patchwork of screens and radio calls that operational awareness previously depended on.
Context & Problem
Container terminals are dense, high-velocity environments. At any given moment, dozens of cranes are working, hundreds of straddle carriers are moving, vessels are loading and discharging simultaneously, and the yard is in constant flux. Yet the tools available to supervisors and planners have historically been tabular TOS screens — lists, not pictures.
The result is that operational awareness is fragmented. A supervisor who wants to know the state of the terminal has to cross-reference multiple systems, call colleagues on the radio, and build a mental model from disconnected data sources. Under time pressure — which is the permanent state of a live terminal — that process breaks down.
There was no tool that answered the simplest question a planner can ask: what does the terminal actually look like right now?
What Was Built
01 · Live Data Ingestion
The twin ingests real-time operational data from the TOS — container positions, crane assignments, vessel berthing state, yard block occupancy — and keeps a continuously updated representation of terminal state in memory.
02 · Web-Based Visualisation
A browser-based interface renders the terminal in spatial context: containers in their yard positions, cranes on their berths, vessels at their quays. State updates are pushed live so the view reflects what is happening now, not what was true when the page loaded.
03 · Operational Overlays
Planners can layer additional context over the base map — congestion indicators, equipment utilisation, workload distribution across the yard — to support shift decisions without switching between systems.
Impact
Operational awareness consolidated into a single real-time view.
The twin removes the need to mentally assemble a picture of the terminal from disconnected data sources. Supervisors can see what is happening, where, and at what scale — without a radio call.
Why This Matters
The value of a digital twin is not the technology — it is the reduction in cognitive load for the people making decisions under pressure. Every second a supervisor spends reconstructing the current state of the terminal is a second they are not spending on the decision that actually needs making.
This project is also a foundation. Once the terminal’s state is continuously legible in a structured form, it becomes the data substrate for everything else: ML model inputs, anomaly detection, capacity planning, and automation triggers.
Role: Lead Developer — Python, Vue, Deck.gl, WebSockets, TOS Integration